Gold Technical Analysis: Break of September top makes $1535 in sight
- Gold prices stay on the back foot around year-start lows.
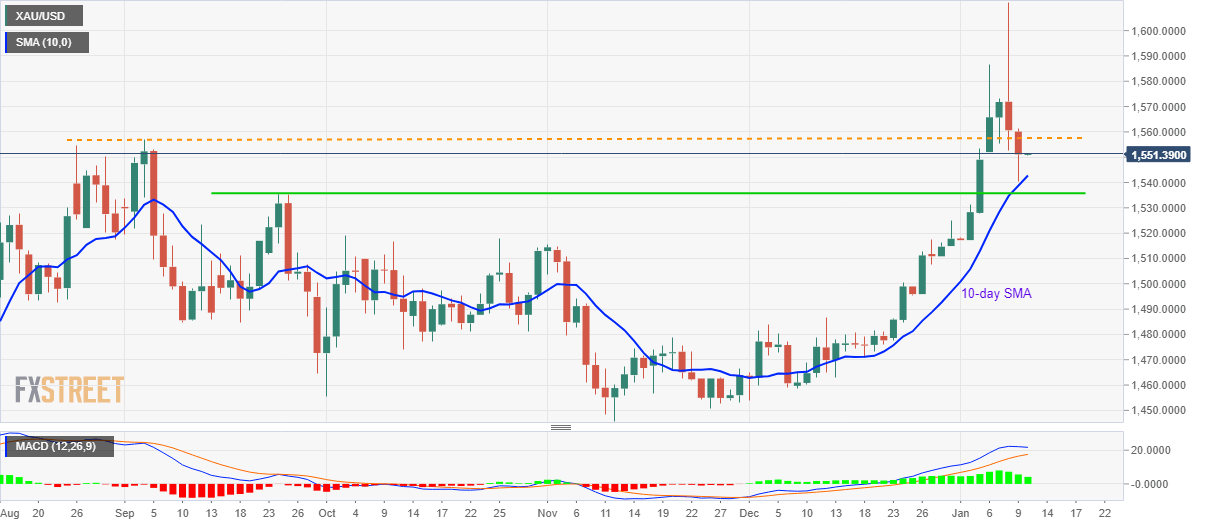
- Failure to stay strong beyond $1,600, break of near-term key support (now resistance) signal the bullion’s weakness.
- 10-day SMA can offer an intermediate halt whereas November high may act as the following support.
Gold remains under pressure while trading around $1,551 during the early Friday morning in Asia. The yellow metal recently slipped below September month high, following its U-turn from $1,600 on Wednesday, which in-turn signal further declines to the next key support established during late-September.
As a result, sellers will now keep eyes on September 24/25 tops near $1,535 ahead of targeting the November month peak, at $1,515.38.
However, a 10-day SMA level of $1,542.77 and October month high close to $1,519 can offer additional rest-points to watch.
On the upside, buyers will look for entry beyond the support-turned-resistance of $1,557.
In doing so, $1,573 and $1,600 will become the Bull’s favorites ahead of looking towards the recently top, also the highest since early 2013, of $1,611.30.
Gold four-hour chart
Trend: Further weakness expected