USD/CHF Price Analysis: Bulls aim for 200-week SMA as MACD turns strongest in nine weeks
- USD/CHF registers three-week winning streak, breaks above 38.2% Fibonacci retracement for the first time in a year.
- 61.8% Fibonacci retracement, September 2018 low act as the key supports.
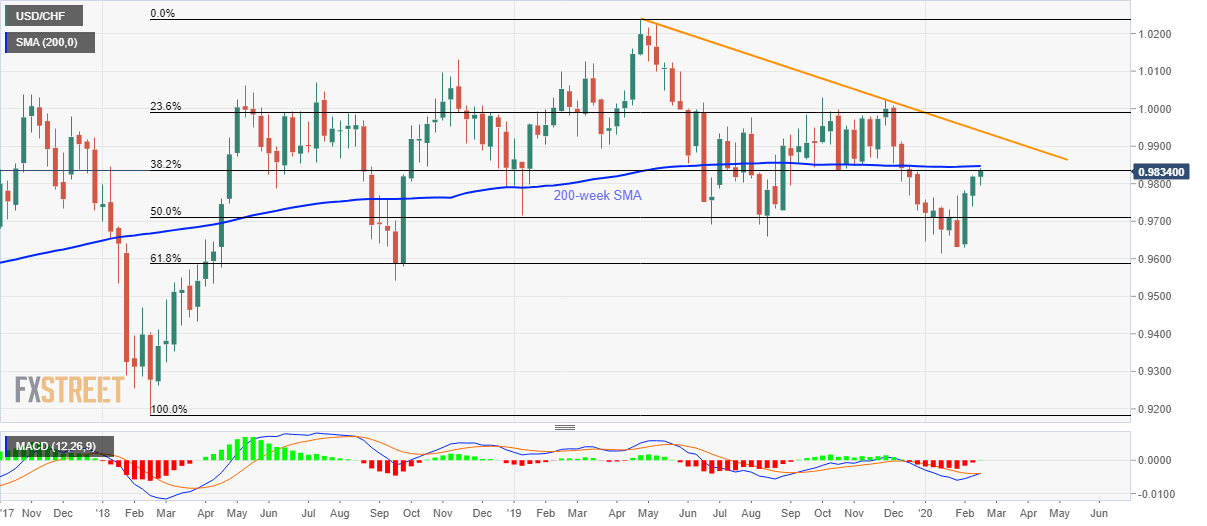
USD/CHF takes the bids to 0.9835 amid the pre-European session on Wednesday. In doing so, the pair crosses 38.2% Fibonacci retracement of its broad run-up between February 2018 and April 2019. Also supporting the pair’s upside is a first in nine weeks bullish MACD signal.
Based on that, buyers are again targeting a 200-week SMA level of 0.9850 whereas a descending trend line from April 2019, at 0.9940 can question the bulls afterward.
In a case where the USD/CHF prices stay strong beyond 0.9940, chances of witnessing the 1.0000 mark on the chart can’t be ruled out.
Alternatively, 0.9770/65 and 50% Fibonacci retracement level around 0.9710 can entertain sellers during the pullback ahead of pleasing them with the yearly bottom of 0.9612.
However, 61.8% Fibonacci retracement and September 2018 trough near 0.9585 and 0.9540 respectively could challenge the bears during the further declines.
USD/CHF weekly chart
Trend: Bullish